Bring FRED into the conversation with your favorite AI applications and tools.
Overview
This is the official FRED MCP Connector of the Federal Reserve Bank of St. Louis. The FRED MCP Connector uses an open-source standard empowering users to surface the FRED data they need directly in their preferred AI environments. Natural-language access extends your ability to engage with datasets coming to FRED from organizations around the world.
Questions? Contact us.
Access and Authentication
MCP endpoint (you do not need to navigate to this URL in your browser): https://mcp.stlouisfed.org
If FRED appears in your AI assistant's connector directory, you can add it from there. Otherwise, add it as a custom connector using the URL above. Instructions for adding custom connectors are available at your AI provider of choice.
When you connect, you'll be redirected to sign in.
New users - create a free FRED MCP account by clicking the "Sign up" link at the bottom of the Okta view below. You'll be asked to accept the Terms of Service and Privacy Policy once, at signup.
Returning users: - sign in with your existing account. You won't be asked to accept the terms again.
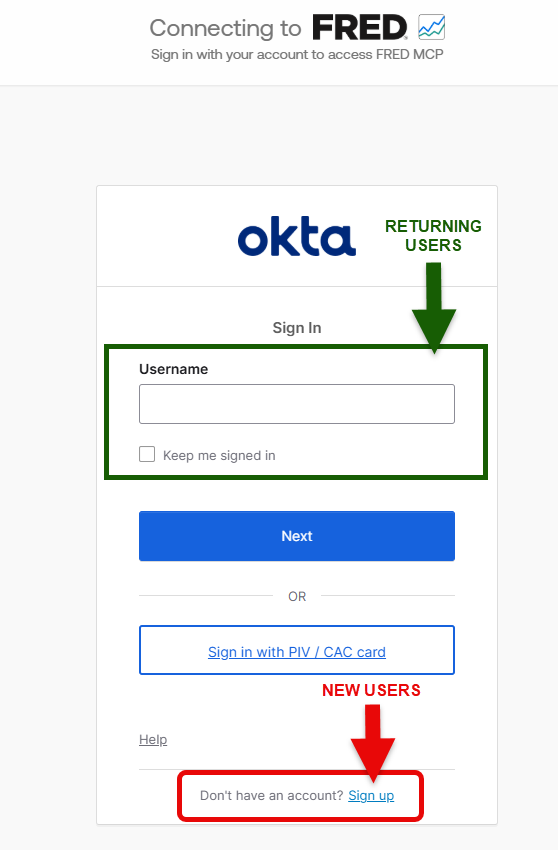
Authorize your AI assistant to access FRED on your behalf, and you'll be returned to the conversation.
You only create one account. If you use FRED from more than one AI assistant, sign in with the same account in each. Each assistant needs its own authorization, but not a separate signup.
No FRED API key is required.
Getting Started
After connecting FRED to your AI assistant, try asking:
What is the latest unemployment rate?
or:
How has inflation changed over the past five years?
Your assistant uses the FRED tools to find appropriate economic series, retrieve their data, and answer your question.
Available Tools
FRED MCP provides five tools:
- fred-search-series - Search FRED for economic time series using keywords or economic concepts. The starting point when you don't know a series ID. Example: "Find a FRED series for prime-age labor-force participation."
- fred-get-series-metadata - Get information about a series: units, frequency, seasonal adjustment, source, and descriptive notes. Example: "What exactly does the UNRATE series measure?"
- fred-get-series-observations - Retrieve observations for a series, optionally restricted to a date range, transformed (changes, growth rates), or aggregated to a lower frequency. Example: "Give me monthly unemployment since 2020."
- fred-download-series-observations-link - Generate a downloadable CSV or JSON dataset, with the same transformation and date-range options. Example: "Download year-over-year CPI inflation since 1990 as CSV."
- fred-graph-series - Create an interactive FRED chart containing up to five series, each with its own transformation and left/right axis. Example: "Graph unemployment and labor-force participation since 2000."
You Don't Need to Know Series IDs
Every FRED series has an identifier, such as:
- UNRATE - Unemployment Rate
- CPIAUCSL - Consumer Price Index for All Urban Consumers
- FEDFUNDS - Federal Funds Effective Rate
You can use these when you know them, but you usually don't need to. Instead of "Get UNRATE," just ask "What is the U.S. unemployment rate?" Your assistant searches for an appropriate series and retrieves it.
Search results include the series ID, units, frequency, seasonal adjustment, source, release, historical coverage, and notes - which helps the assistant choose among similar measures.
Getting and Analyzing Data
Ask directly for current or historical data:
What is the latest unemployment rate? Show unemployment since 2000. How has labor-force participation changed since 1990?
FRED can also transform data during retrieval:
What is the year-over-year CPI inflation rate? How much did payroll employment change each month this year? What was real GDP growth?
The right calculation depends on how a series is measured, and your assistant inspects the series metadata before choosing one. For example, an unemployment rate expressed in percent is already a rate, while a price index is not itself an inflation rate - inflation is calculated from changes in the index.
Comparing Indicators
Compare CPI and PCE inflation. Compare unemployment with job openings. How have wages behaved relative to inflation?
The assistant retrieves the relevant series and analyzes them together. When similar measures differ in definition, it can use FRED metadata to explain the differences.
Creating Graphs
Graph the unemployment rate since 2000. Plot mortgage rates and the federal funds rate together.
FRED graphs can contain up to five series, transformed individually and displayed on left or right axes.
Downloading Data
Download unemployment since 1980 as CSV. Give me CPI inflation since 1990 as a CSV.
FRED generates downloadable CSV or JSON files for use in spreadsheets, statistical packages, and programming environments.
Changing Data Frequency
Some series are daily or weekly. FRED can aggregate them to a lower frequency:
Give me monthly averages of this daily interest-rate series.
Aggregation methods are average, sum, and end of period; the right choice depends on what the series measures.
Reading the Data
A few FRED conventions worth knowing:
- A “.” in the observations means the value is missing for that period - it is not zero.
- The date on an observation is the period it measures, not the date it was published or retrieved.
- Responses include realtime_start and realtime_end, which record the as-of date of the data. Economic statistics are revised, so the same observation can change between retrievals.
Example Prompts
- What is the latest unemployment rate?
- What do recent data say about the U.S. labor market?
- How has core inflation changed recently?
- Compare CPI and PCE inflation.
- Graph the federal funds rate since 1990.
- What happened to unemployment in previous recessions?
- Find a FRED series for house prices.
- Download monthly unemployment since 1980 as CSV.
You can also follow up naturally:
How has inflation changed recently? What about core inflation? Graph both since 2019.
Your assistant combines the FRED tools as needed to complete the analysis.
Where the Data Comes From
FRED is maintained by the Research Division of the Federal Reserve Bank of St. Louis. It brings together economic time series from Federal Reserve entities, U.S. government statistical agencies (such as the Bureau of Labor Statistics, Bureau of Economic Analysis, and Census Bureau), international organizations, and other providers. Series metadata identifies the underlying source where available.
Revisions and Limitations
Many economic statistics are revised after initial publication, so values retrieved today may differ from earlier retrievals. When timing matters, consider the observation date, series definition, and underlying source.
AI-generated analysis can contain mistakes. For important research or decisions, verify the relevant series, units, dates, and definitions.
FRED MCP provides access to economic data. It does not provide financial, investment, legal, or policy advice.