There are two convenient ways to download data in FRED. One way is from a FRED graph. This option allows you to download time-series data. Click the “Download” button above any FRED graph, then select one of the available options. “Excel” (.xlsx) and “CSV” (comma separated values [.csv]) will download the data values into a spreadsheet.
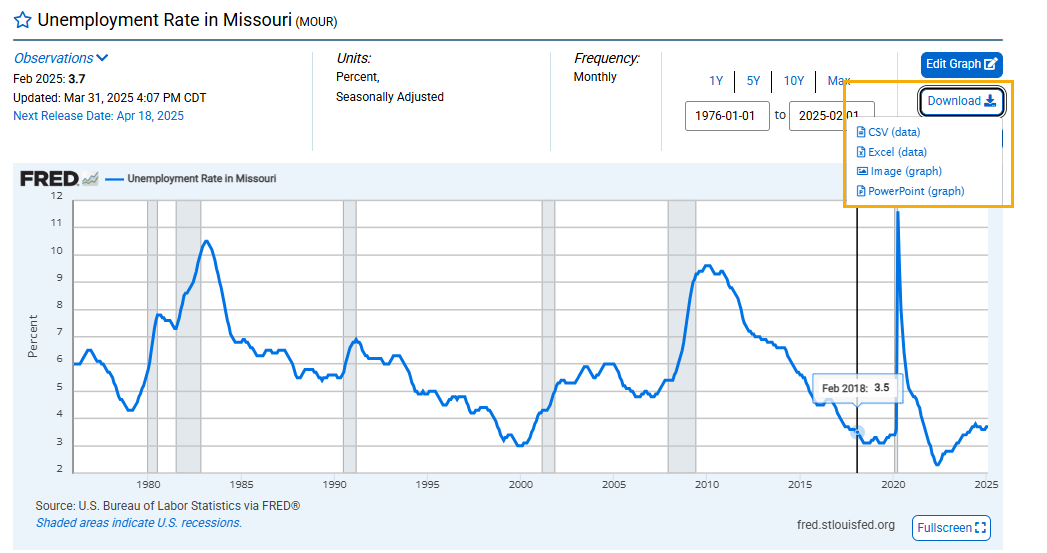
The remaining options export the visual display of the graph. Choose “Image” for a nice general purpose display (.png) of the graph, or “PowerPoint” for a new PowerPoint presentation with the graph on a slide.
Another way to download data is from a FRED map. The advantage of downloading data from a FRED map is that you will download all cross-sectional data. Click the “Download” button above any FRED map and select “CSV (data)” (comma separated values [.csv]). This will download the data values into a spreadsheet.
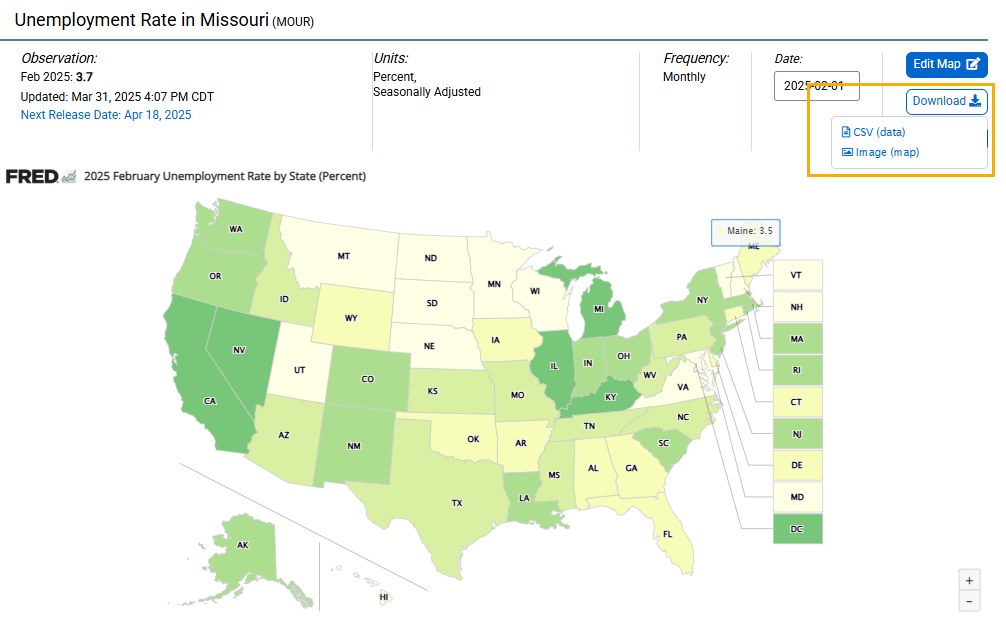
The remaining option exports the visual display of the map. Choose “Image” for a nice general purpose display (.png) of the map.