We always consider more data to be a good thing, but more data brings a need to address potential navigation challenges. We always want to help our FRED users reach the data they need more easily. So let's navigate to a FRED series and see what kind of trouble we can get into.
To start off, locate the Search FRED box in the header here:

Enter "GDP" into the Search FRED box, take a deep breath, and hit return.
Before we dive deeper, let's establish some basics. We'll break this down into two sections:
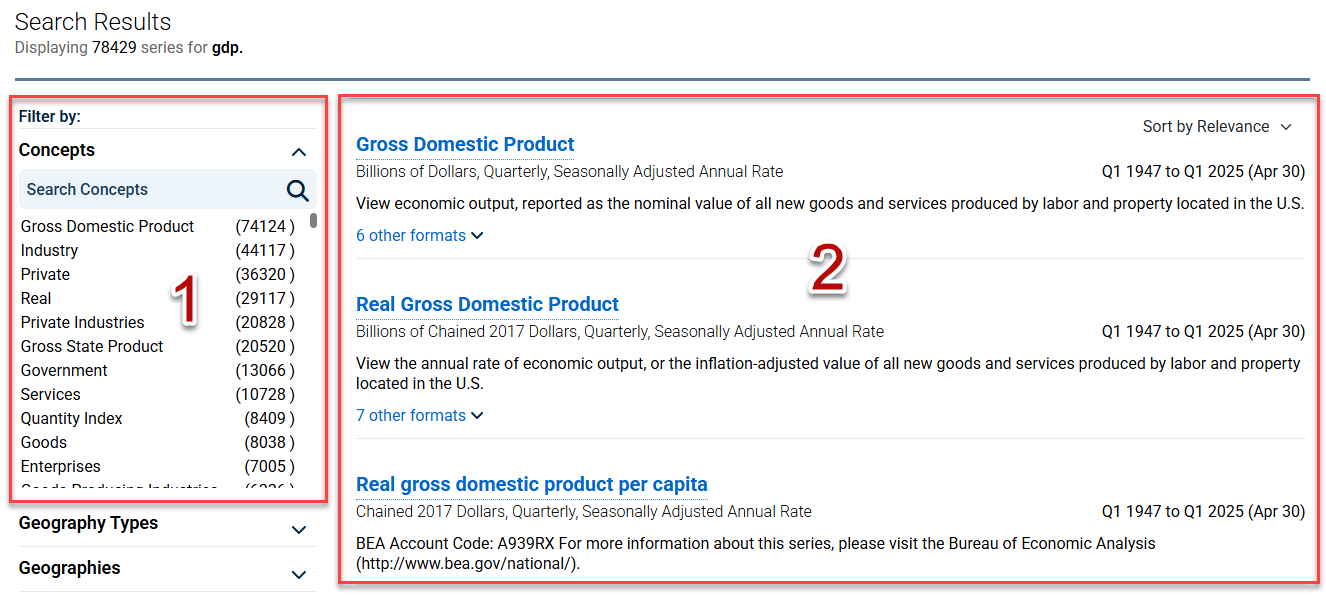
1) Let's call this the Series Filter Interface.
2) Let's call this the Series Results List.
The Series Filter Interface
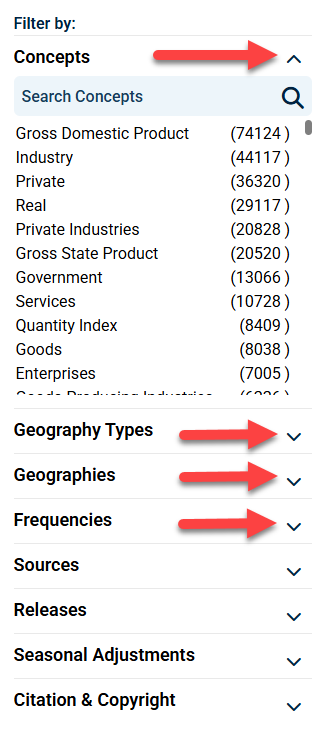
FRED filters are essentially FRED series metadata that have been parsed out to their most finite terms. These metadata allow the user to sort through vast amounts of information very quickly. The filters displayed in the Series Filter Interface pertain only to the series that we have in our Series Results List. In our case here, there are more than 70,000 series in FRED that are associated with GDP. Therefore, all of the tags shown are associated with these series. FRED filters are broken down into 8 sections: Concepts, Geography Types, Geographies, Frequencies, Sources, Releases, Seasonal Adjustments, and Citation & Copyright. Each section can be collapsed or expanded by hitting the chevron illustrated by the red arrows in the picture above.
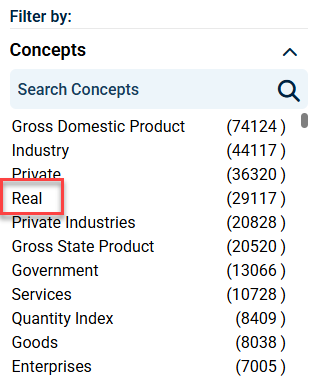
Let's move through the interface and then work through an example of how tags can help us quickly sub-set data. Say we want Real GDP data. You can quickly jump through the Series Filter Interface to get your results. Simply expand the Concepts menu by hitting the plus and search for "Real" there.
Selecting "Real" will trim our results down by tens of thousands of series. The first result in your Search Results List is Quarterly, Seasonally Adjusted Annual Rate, Real GDP for the United States. At this point, you can click on a series title, which will take you to the graph page. You can also further refine the search with the filters. If you want annual data, go to the Frequencies section of the Series Filter Interface and select Annual. Similarly, if you want data that is not seasonally adjusted, go to the Seasonal Adjustments section and select Not Seasonally Adjusted.
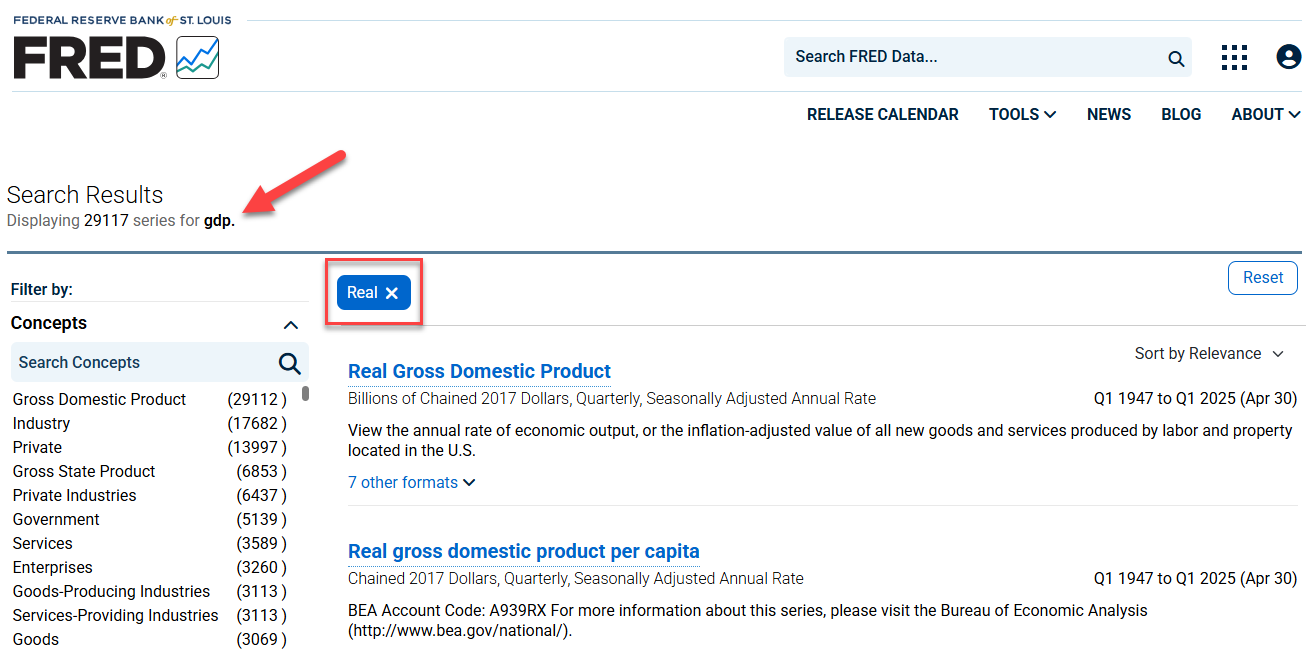
Let's say we no longer want "Real" (inflation-adjusted) data all by itself. Notice the filter (in red) that appears above the Series Results List. To remove the "Real" filter, simply click the x.
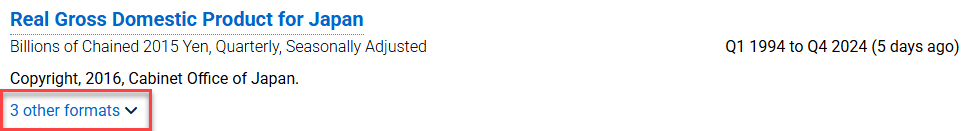
In the Series Results List, you might notice groupings occasionally have other formats with a drop-down arrow. These groupings contain other metadata combinations such as unit or frequency differences.