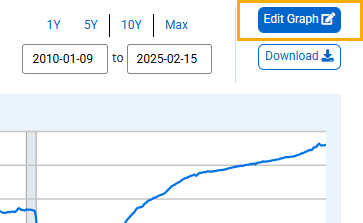
Frequency aggregation converts higher-frequency data series into lower-frequency data series (e.g., from monthly data to annual data). In FRED, the highest data frequency is daily and the lowest is annual. To access this feature, above the graph, click the “EDIT GRAPH” button.
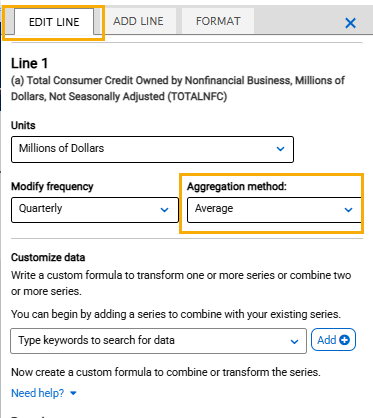
In the pop-up box that appears, click the “EDIT LINE” tab. (If you have more than one line on the graph, click the “EDIT LINE” drop-down menu and select the line [series] you want to edit.) If you modify the frequency, the “Aggregation method” drop-down box will appear. Choose one of the following aggregation options:
Average: This method averages original series values to calculate the lower frequency (e.g., for a monthly data series for 2012, the sum of the 12 monthly values are divided by 12 to produce an annual data value for 2012).
Sum: Similarly, this method adds data values to calculate the lower frequency (e.g., for a monthly data series for 2012, the 12 monthly value are added and the sum becomes the annual data value for 2012).
End-of-period: This method takes the last value at the end of the period and uses it as the lower frequency (e.g., for a monthly data series for 2012, the December 2012 value would be used as the annual data value for 2012).