One of the best features of our new FRED graphs is the ability to easily embed them in your own blog or website. The embedded graphs even retain the interactive tooltips and zoom capability! It takes just 3 easy steps.
STEP 1
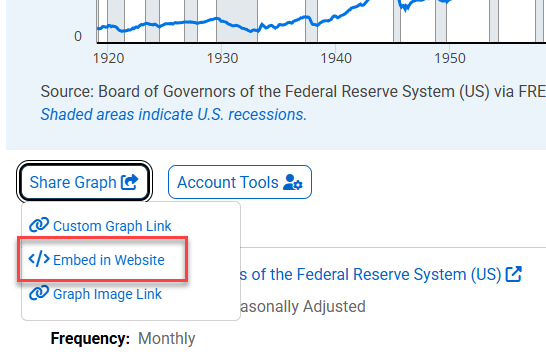
Customize your graph as you normally would using the options below the graph by clicking on the “Share Links” button. Click on the “Embed in website” option.
STEP 2
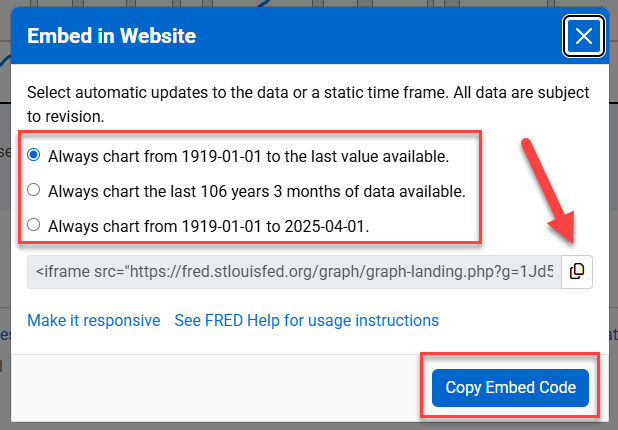
After clicking on “Embed in website,” a pop-up window will appear with options for your graph. If you have the latest observation on your graph, you will receive options based on the time range of your graph. You are given three options for the date range: a rolling window of the same length, a sample always starting at your chosen date and ending with the most recent data point, or the exact date range the graph shows. If your time range does not include the most recent observation, you will not have options as illustrated by the second image. Click the copy icon next to the red arrow or the “Copy Embed Code” button.
STEP 3
Paste the code into the HTML of your site…and voilà!
STEP 4 (Optional)
For a responsive graph: Click the link on modal to "Make it responsive" or to do it manually wrap the embed code in a <div> block element with a class of embed-container:
<div class='embed-container'>EMBED CODE</div>
iframe src="//fred.stlouisfed.org/graph/graph-landing.php?g=j37b&width=670&height=475" scrolling="no" frameborder="0" style="overflow:hidden; width:670px; height:525px;" allowTransparency="true" loading="lazy">/iframe
NOTE: Make sure both height and width are set on the iframe container AND the iframe src url. This will avoid any resizing and make your graphs load faster.
Include the embed.js file on the bottom of your page:
NOTE: If you are embedding multiple graphs on your page only include this Javascript file once.
<script src="https://fred.stlouisfed.org/graph/js/embed.js" type="text/javascript"></script>