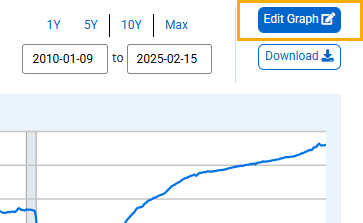
Above the graph, click the "EDIT GRAPH" button.
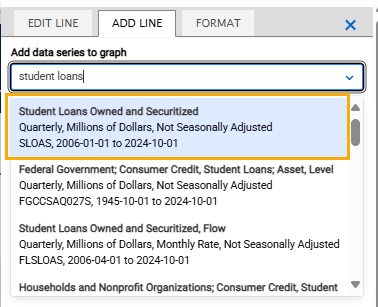
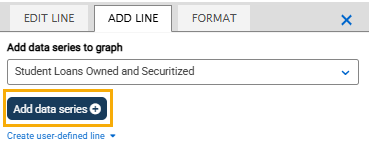
In the pop-up box that appears, click the “ADD LINE” tab. Click the text box and type keywords for the series you want to add.
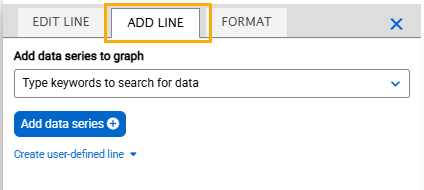
A list of the most popular suggestions will appear. Select the series you want to add.
Click the “Add Data Series” button. The graph will update automatically with the new series.
If the two series have different units or their magnitudes are drastically different, you will probably want to change the Y-axis position for one of the series, which defaults to the left for all series. To change an axis, select the “EDIT LINE” drop-down menu and select the line (series) you want to edit. Next, click “FORMAT” tab (to the right of the “ADD LINE” tab). By “Y-Axis position,” select “Right” to adjust the Y-axis position.
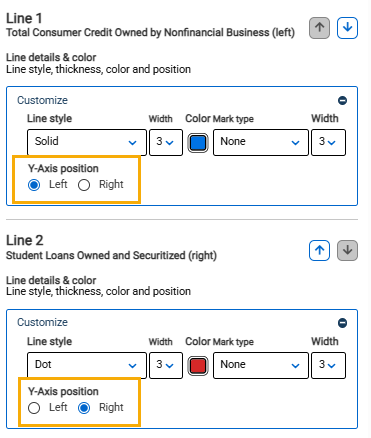
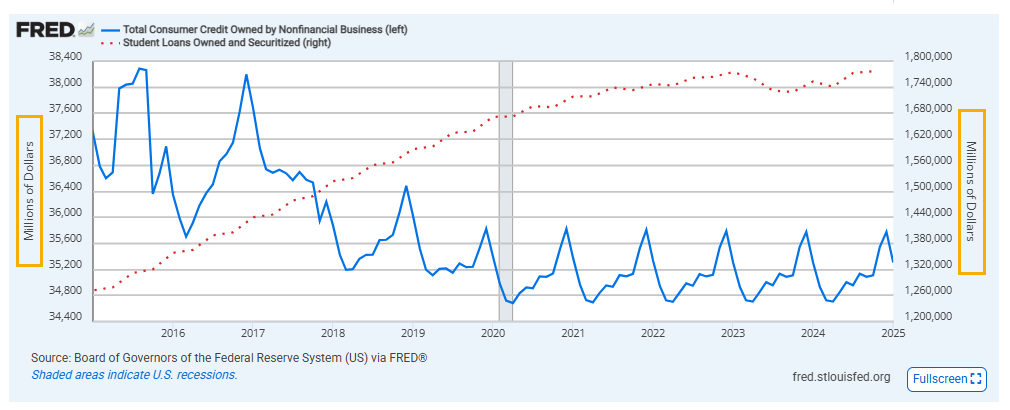
After all of these steps are completed, you will have two data series plotted on the graph with a dual-axis graph.