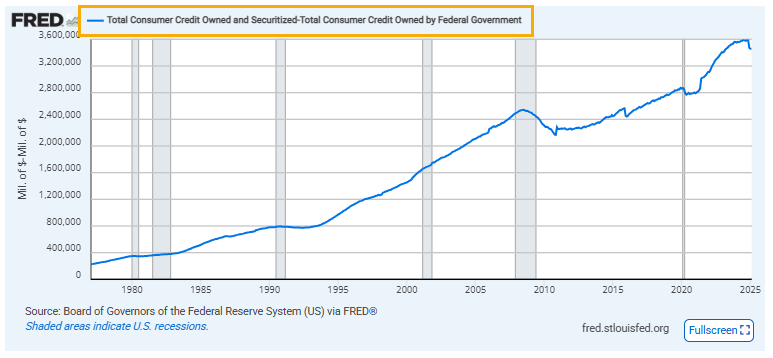
You can create a customized formula to combine two series on one graph line.
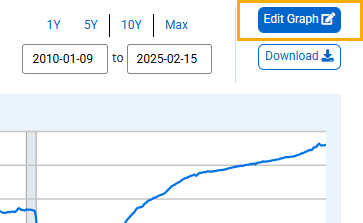
To do so, above the graph, click the “EDIT GRAPH” button.
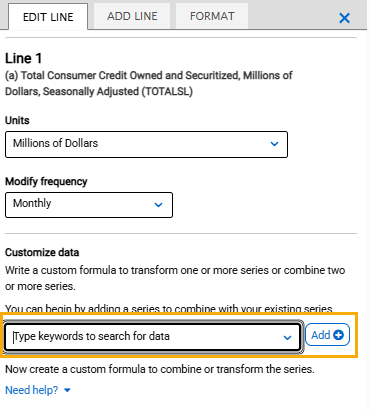
In the pop-up box that appears, click the “EDIT LINE” tab. (If you have more than one line on the graph, click the “EDIT LINE” drop-down menu and select the line [series] you want to add another series to.) Under “Customize data,” click the text box and type keywords for the series you want to add.
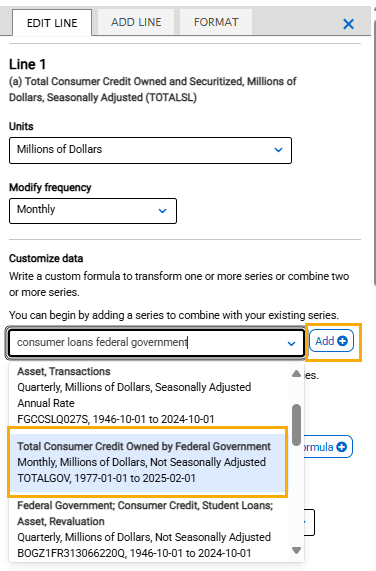
A list of the most popular suggestions will appear. Select the series you want to add and click the “Add” button.
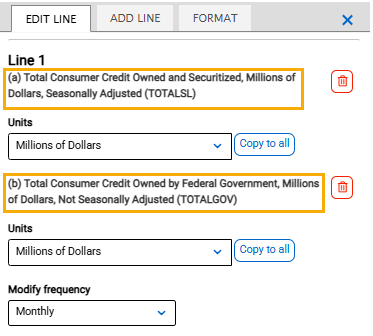
The title of the added series will appear in the “EDIT LINE” tab of the series you are adding to. Before each series title there is a letter in parentheses. Use these letters as the variables in your formula to indicate the given series.
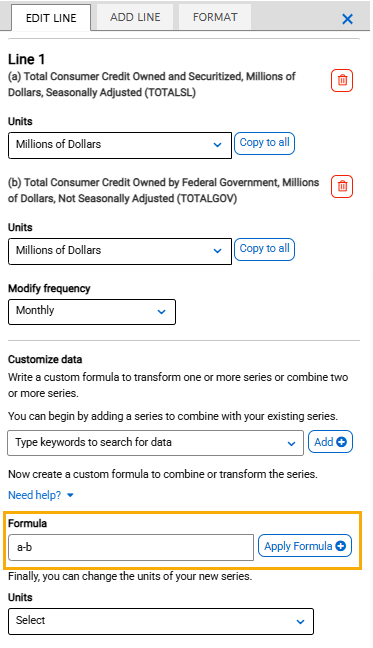
In the text field next to “Formula,” type your formula. Use the assigned data series variables (a, b, c, etc.) together with operators (+, -, *, /, ^, etc.), parentheses and constants (1, 1.5, 2, etc.) to create your own formula (e.g., 1/a, a-b, (a+b)/2, (a/(a+b+c))*100).
Then click the “Apply” button.
The graph will update automatically and apply the formula.