Customize your graph by adding a straight line between two data points.
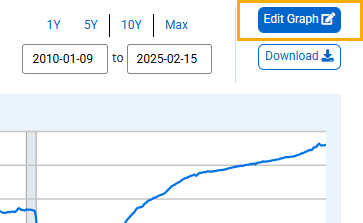
To create a user-defined line, above the graph, click the “EDIT GRAPH” button.
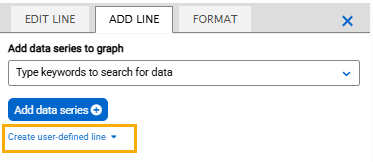
In the pop-up box that appears, select the “ADD LINE” tab. Click the “Create user-defined line.”
Next click “Create line.”
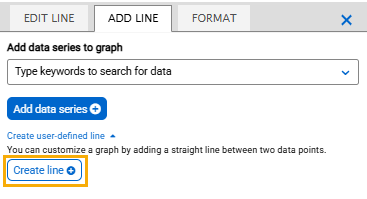
A default line will appear from the first data observation to the most recent data observation.
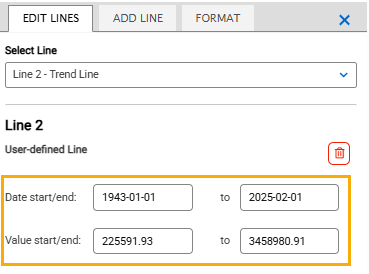
To customize the line, (i) click the “Date start/end” box and select the year and months from the pop-up options or (ii) type values in “Value start/end” boxes.
Date start/end: Input the dates of interest to change the length of the line.
Value start/end: Input the values of interest to change the slope of the line.
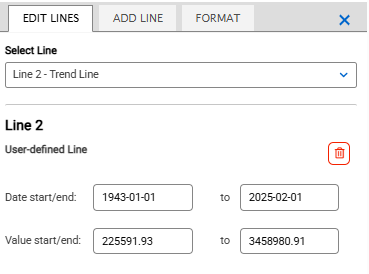
Click the red trash can button to remove the line from the graph.
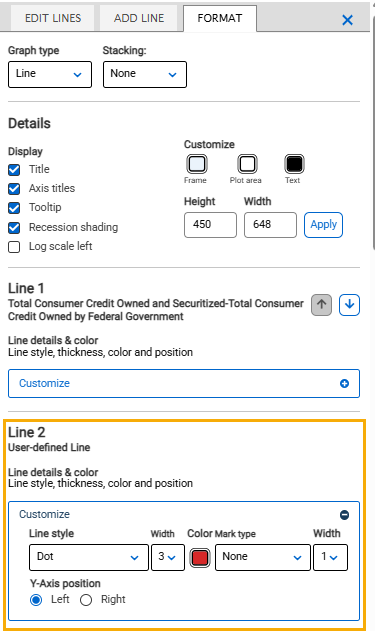
To change other line settings, you will need to click the "FORMAT" tab.
Color: Click the box to reveal a pop-up pallet of colors from which to choose a line color.
Line Style: Click the drop-down menu and select “Solid,” “Dash,” “Dot,” or “DashDot.”
Width: Click the drop-down menu and select “1,” “2,” “3,” “4,” or “5.”