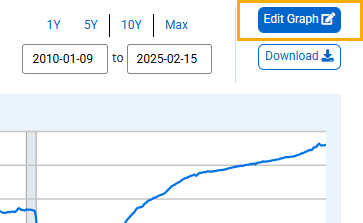
Above the graph, click the "EDIT GRAPH" button.
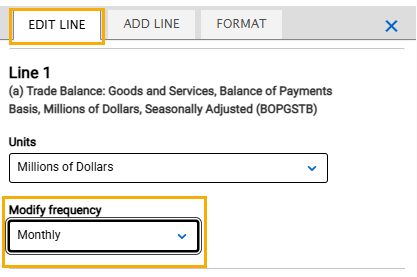
In the pop-up box that appears, click the “EDIT LINE” tab. (If you have more than one line on the graph, click the “EDIT LINE” drop-down menu and select the line [series] you want to edit.) Click the “Modify frequency” drop-down menu and select an option: “Monthly,” “Quarterly,” “Semiannual,” or “Annual.”
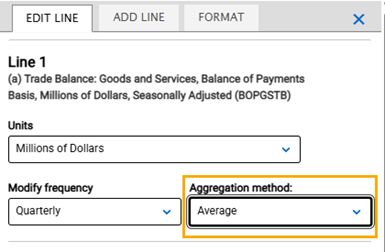
The graph will update automatically with the default aggregation method “Average.” Or select an option from the “Aggregation method” drop-down menu: “Average,” “Sum,” or “End of period.” For more information about frequency aggregation and aggregation methods, see Edit a data series, frequency aggregation.