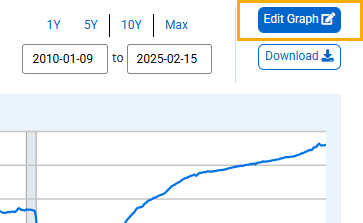
Above the graph, click the "Edit Graph" button.
In the pop-up box that appears, click the “EDIT LINE” tab. (If you have more than one line on the graph, click the “EDIT LINE” drop-down menu and select the line [series] you want to edit.) Click the “Units” drop-down menu and choose an option. The graph will update automatically.
Unit options include the following:
Change; Change from Year Ago; Percent Change; Percent Change from Year Ago; Compounded Annual Rate of Change; Continuously Compounded Rate of Change; Continuously Compounded Annual Rate of Change; Index (the default): Scales the value to 100 for the chosen date.
For more details about the formulas for the Units options go to https://fredhelp.stlouisfed.org/fred/data/understanding-the-data/formulas-calculate-growth-rates/.


